


When choosing a place to live and work from, personal preference and community are important factors in our decision. But so are opportunities, especially those in terms of salary and job openings. While we can’t really generalize the former, we attempted to gauge the latter when it comes to the advertising and marketing industry in the U.S.
Creatopy set out to determine which U.S. metro areas are the most attractive for those working in the industry. In order to rank them, we attributed scores to each metro based on seven metrics:
- The current number of employees in advertising and marketing positions
- The five-year trend for the number of workers in the industry
- The share of industry jobs out of all jobs in the metro
- The average annual wage for advertising and marketing jobs
- The five-year trend for the average annual wage
- Regional price parity
- Internet speed
For more information about our analysis, check out the methodology section at the end of the article.

Top 15 Metros, Population Over 1M
So the comparisons we make would be as relevant as possible, we split the metro areas into two categories based on population. First, we looked at the country’s 53 metropolitan areas with over one million inhabitants.
In this bracket, Chicago-Naperville-Elgin ranked first, with 43.10 points, followed by New York-Newark-Jersey City, totaling 42.05 points. Washington-Arlington-Alexandria took the last place on the podium with 41.90 points.


#1 Chicago: A Rapidly-Growing Market
With roughly 57,440 employees in advertising and marketing positions, the Chicago metropolitan area has the second-highest number of industry jobs in the country. Scoring very high in this respect, as well as for the growth it saw in terms of both jobs and annual salary since 2015, is what propelled the metro into first place.
According to data from the Bureau of Labor Statistics, the number of advertising and marketing jobs in the Chicago metro area increased by a staggering 55% in the last five years. In raw numbers, the metro has added 20,330 employees in the industry since 2015. Impressive, considering NYC, which has an industry more than double in size, added a close 26,310.
Along the same lines, the average annual wage for advertisers and marketers in Chicago has increased by nearly 17% since 2015 — the fastest growth among the metros on our top 15 list.
While this average annual salary is not the highest, at $95,920, the cost of living in the metro makes up for it. When looking at the Regional Price Parity (RPP) indicator, Chicago is the fourth most affordable metro on our list.
#2 New York City: An Established Industry Hub
The NYC metro is the biggest industry hub by far, boasting the largest number of employees in advertising and marketing, roughly 130,760. Several major agencies have offices here, including BBDO, McCann, Ogilvy, and TBWAChiatDay, to name a few. And, Madison Avenue in Manhattan is often referenced as the epicenter of the industry.
However, the number of employees here has seen a somewhat slower evolution compared to the other metros we looked at. Industry jobs in the New York City metro grew by a modest 25% in the past five years, with 23 other big metros having had faster growth rates in this respect.
Besides a large number of job opportunities, another reason why the metro attracts marketers and advertisers is the fact that the annual salary here is the third-highest in the country. After a growth of nearly 11% since 2015, it rests at an average of $118,107, surpassed only by wages in the Bay Area metros of San Jose and San Francisco.
The other side of the coin in the case of these metros, however, is the fact that they are also the priciest in the nation. NYC has a Regional Price Parity index of 125.7, meaning that living here is nearly 26% more expensive than the national average.
#3 Washington, D.C.: A Well-Balanced Mix
The D.C. metro snatched the third spot on our list due to its high wage growth, great internet speed, and overall scoring above average for most of the metrics we looked at.
Washington-Arlington-Alexandria is home to the sixth-biggest industry in the country, with 34,360 employees here working in advertising and marketing. This number grew by nearly 40% in the past five years, as the metro added 9,790 new positions.
In terms of wage, D.C. is among the seven U.S. metros with an annual average of over $100,000. This wage increased by 13% during the period we considered, marking the second-highest growth on our top 15 list, after Chicago. It is currently $102,211.
Finally, when it comes to internet speed — a key factor in the era of working from home — the metro claims the third spot in our top 15, with an average of 439.8 Mbps.
Other Notable Entries
Coming in fourth is the Boston-Cambridge-Newton metro area, which boasts an industry representation in the workforce on par with NYC. Advertising and marketing jobs here represent 0.49% out of all jobs and sum up 38,360 positions. Despite this and a high annual average wage of $109,766, Boston missed the top three due to slower growth rates.
Atlanta-Sandy Springs-Alpharetta claimed the sixth place on our list and stood out for the big increase it saw in terms of salary. The average annual wage in the industry in Atlanta grew by 13% since 2015 — the largest increase after Chicago and D.C. In addition, the fact that the metro is among the most affordable ones, with an RPP index of 97.9, is definitely a plus in this context.
With 55,660 workers in advertising and marketing, Los Angeles-Long Beach-Anaheim is third in the country when it comes to industry size, after NYC and Chicago. However, the metro lags behind in terms of industry representation, as only 0.32% of the jobs here are positions in the field. Moreover, a slow growth rate of only 7% in the number of industry jobs put the L.A. metro at #11.
Dallas-Fort Worth-Arlington is the only Texas metropolitan area to make our list, coming in at #12. The industry here totals 26,550 jobs, and it grew by 46% since 2015 — the fourth-fastest growth in our top 15. DFW is also among the more affordable metros, with a Regional Price Parity index of 101.2. In addition, it has the ninth-best internet speed in the country, at 425.9 Mbps.
The Silicon Valley metro of San Jose-Sunnyvale-Santa Clara ranked first and received the maximum score for both industry representation and average annual wage. Advertising and marketing jobs here make up 0.64% of all jobs, and the average annual wage is an impressive $147,237. On the other hand, with roughly 20,860 employees, the metro has a smaller industry than most of the others on our list. This aspect, combined with the fact that San Jose is the second most expensive metro in the country, is what pushed it to the 13th place.
Closing our top 15 list is the Detroit-Warren-Dearborn metro area, earning its place primarily due to its high growth rate in terms of the number of jobs, 67%. While the industry here is still small compared to the others on our list, with 15,640 employees working in advertising and marketing, the metro shows potential to develop rapidly and is worth keeping an eye on in the near future.
Top 10 Metros, Population Under 1M
Similarly, we also analyzed 111 smaller metros, with populations between 300,000 and one million inhabitants. For this bracket, we went through the same process to select the ten best metro areas for advertisers and marketers.
It’s worth mentioning that due to the method we used to calculate the final scores, comparisons should not be drawn between entries on our top 15 and top ten lists based on the number of points, as they would be misleading.
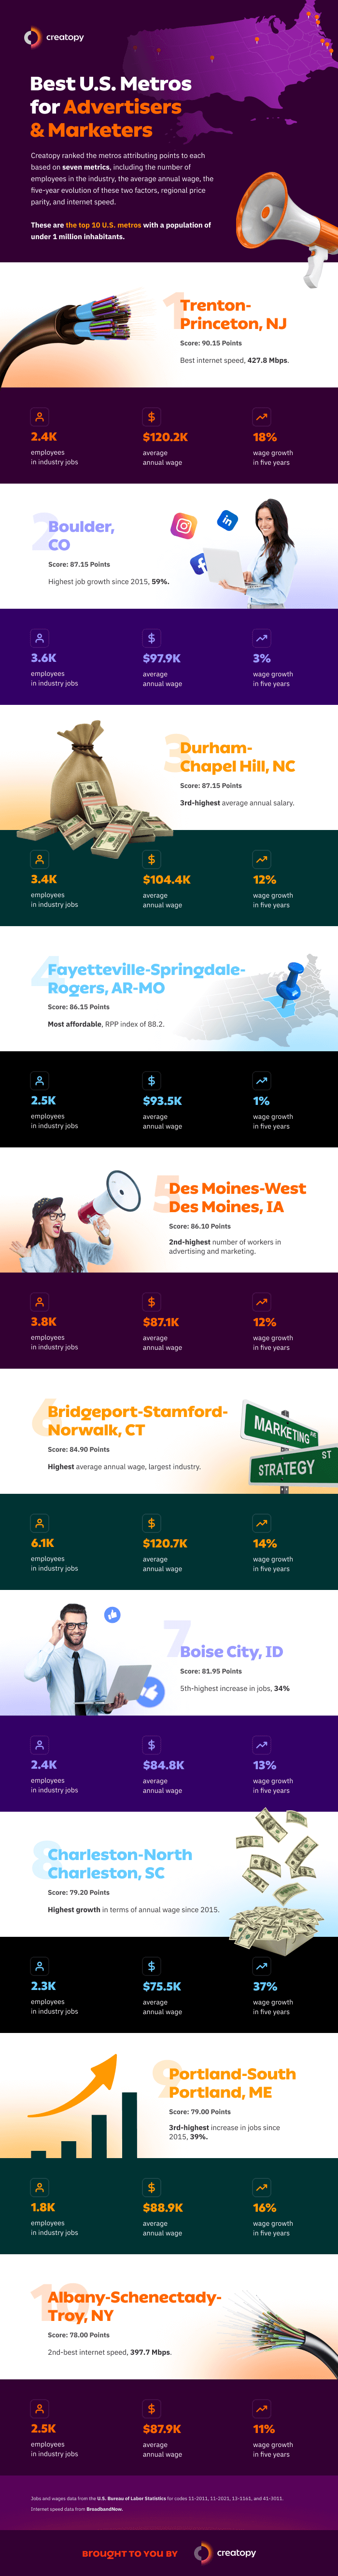

Trenton-Princeton, N.J., claimed first place in this category, with a total of 90.15 points. The metro performed great overall, but it stood out for its high average annual wage of $120,170, as well as for having high growth rates in terms of both jobs (55%) and salary (18%). In addition, the Trenton metro boasts the best internet speed out of our ten smaller metros, 427.8 Mbps.
Coming in second is Boulder, Colo., with 87.15 points. The metro had the highest job growth since 2015 (59%), as well as the highest industry representation — 0.67% of all jobs in the metro are in advertising and marketing. The average annual wage here is $97,878.
Closing our top three smaller metros is Durham-Chapel Hill, N.C., also with 87.15 points. Because we had a tie between Boulder and Durham, we decided to give second place to the metro with a bigger industry. This metro is Boulder, with 3,570 employees in advertising and marketing, compared to Durham’s 3,360. Durham, however, does surpass its rival in terms of annual wage, which averages $104,399 here.
Des Moines, Iowa, claimed fifth place, racking up points for industry size and affordability. The metro has 3,760 employees working in the industry, and this number has increased by 29% since 2015. In addition, Des Moines has a Regional Price Parity of 92.3, meaning that living here is roughly 8% more affordable than the national average.
Bridgeport-Stamford-Norwalk, Conn., had both the largest number of employees in advertising and marketing positions (6,090) and the highest annual average salary ($120,703) on our smaller metros list. However, the industry here has developed at a lower rate of only 4% since 2015. This, coupled with an RPP of 112.4, pushed Bridgeport to #6.
Finally, in eighth place we have Charleston-North Charleston, S.C., a metro worth keeping an eye on due to its notable wage growth — a 37% increase since 2015, the highest on our list. While it has the lowest average annual salary, at $75,516, that might easily change if this high growth rate is maintained in the future.
Wrapping Things Up
Picking where to settle down is an important life decision, including for us working in advertising and marketing. Choose the right place for you — one that makes you feel at home while also providing you with the opportunities you need to grow — and the inspiration to create engaging ads, the energy to plan complex marketing strategies, and the chance to reach your full potential will follow.
Let us know in the comments below which of these metros you would like to live and work in and why.
Methodology
In our analysis, we included a total of 164 U.S. metro areas — 53 metros with a population of over one million and 111 metros with a population of between 300,000 and one million inhabitants. To divide the metros based on population we looked at numbers from the U.S. Census Bureau.
In order to rank the metro areas, we considered seven metrics.
The first five are based on the latest available data from the Bureau of Labor Statistics, for codes 11-2011, 11-2021, 13-1161, and 41-3011, and are as follows:
- The total number of employees in advertising and marketing positions in 2020.
- The five-year trend for the number of jobs in the industry, calculated as the percentage difference between the total number of employees in 2020 vs. 2015.
- The industry representation, namely the share of industry jobs out of the total number of jobs.
- The average annual wage for advertising and marketing jobs, calculated as the weighted average of the annual wages for the codes mentioned above.
- The five-year trend for the average annual wage, calculated as the percentage difference between the average annual wage in the industry in 2020 vs. 2015.
In addition, we used two other metrics:
- Regional Price Parity, which measures the differences in price levels across metropolitan areas and is expressed as a percentage of the overall national price level, from the Bureau of Economic Analysis.
- Internet speed in Mbps., from Broadbandnow.com.
We recognize that not all of these metrics are equally important when considering a certain metro, which is why we weighted each of them differently:
- Number of employees: 25%
- Five-year jobs trend: 10%
- Industry representation: 20%
- Annual wage: 25%
- Five-year wage trend: 10%
- Regional Price Parity: 10%
- Internet speed: 5%
Scores were calculated by multiplying each metro’s ranking for a given metric with that metric’s weight.