With interest rates, inflation rates, and consumer prices on the rise this year, it should come as no surprise to business owners and marketers that advertising costs have increased, too.
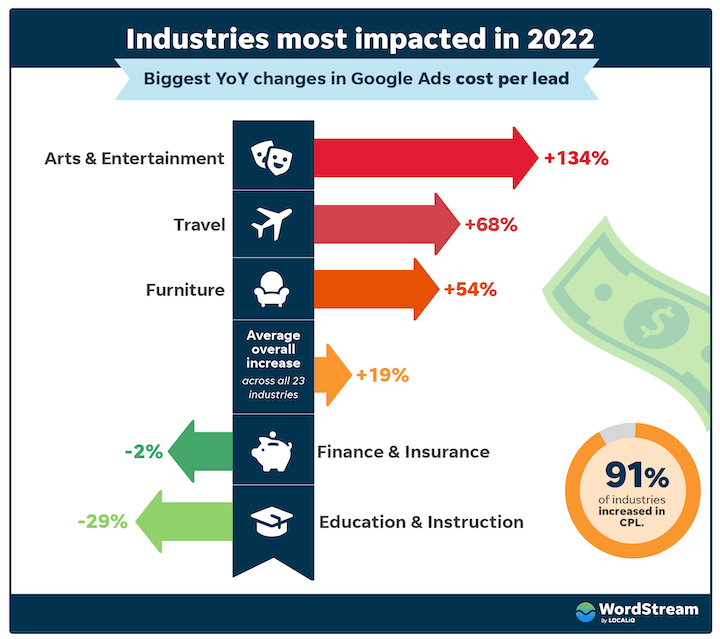
And new data shows that for search advertising, in particular, cost per lead has gone up for 91% of industries.
Just how much has it increased, and what can you do? Read on to learn the key trends in search advertising and how to adapt so you can plan a winning strategy for 2023.
The Search Advertising Landscape: Key Trends and Takeaways
Below you’ll find the most important trends we’re seeing this year in search advertising based on the latest search advertising benchmarks from WordStream by LocaliQ. The data comes from analyzing key metrics in 23 industries.
Cost per lead
Cost per lead (CPL), also known as cost per action (CPA), is the amount you spend to get a conversion on your ad, where a conversion can mean a purchase, a content download, a call, a newsletter signup, or any other desired action.
The average cost per lead for search ads across all industries in the study was $40.74.
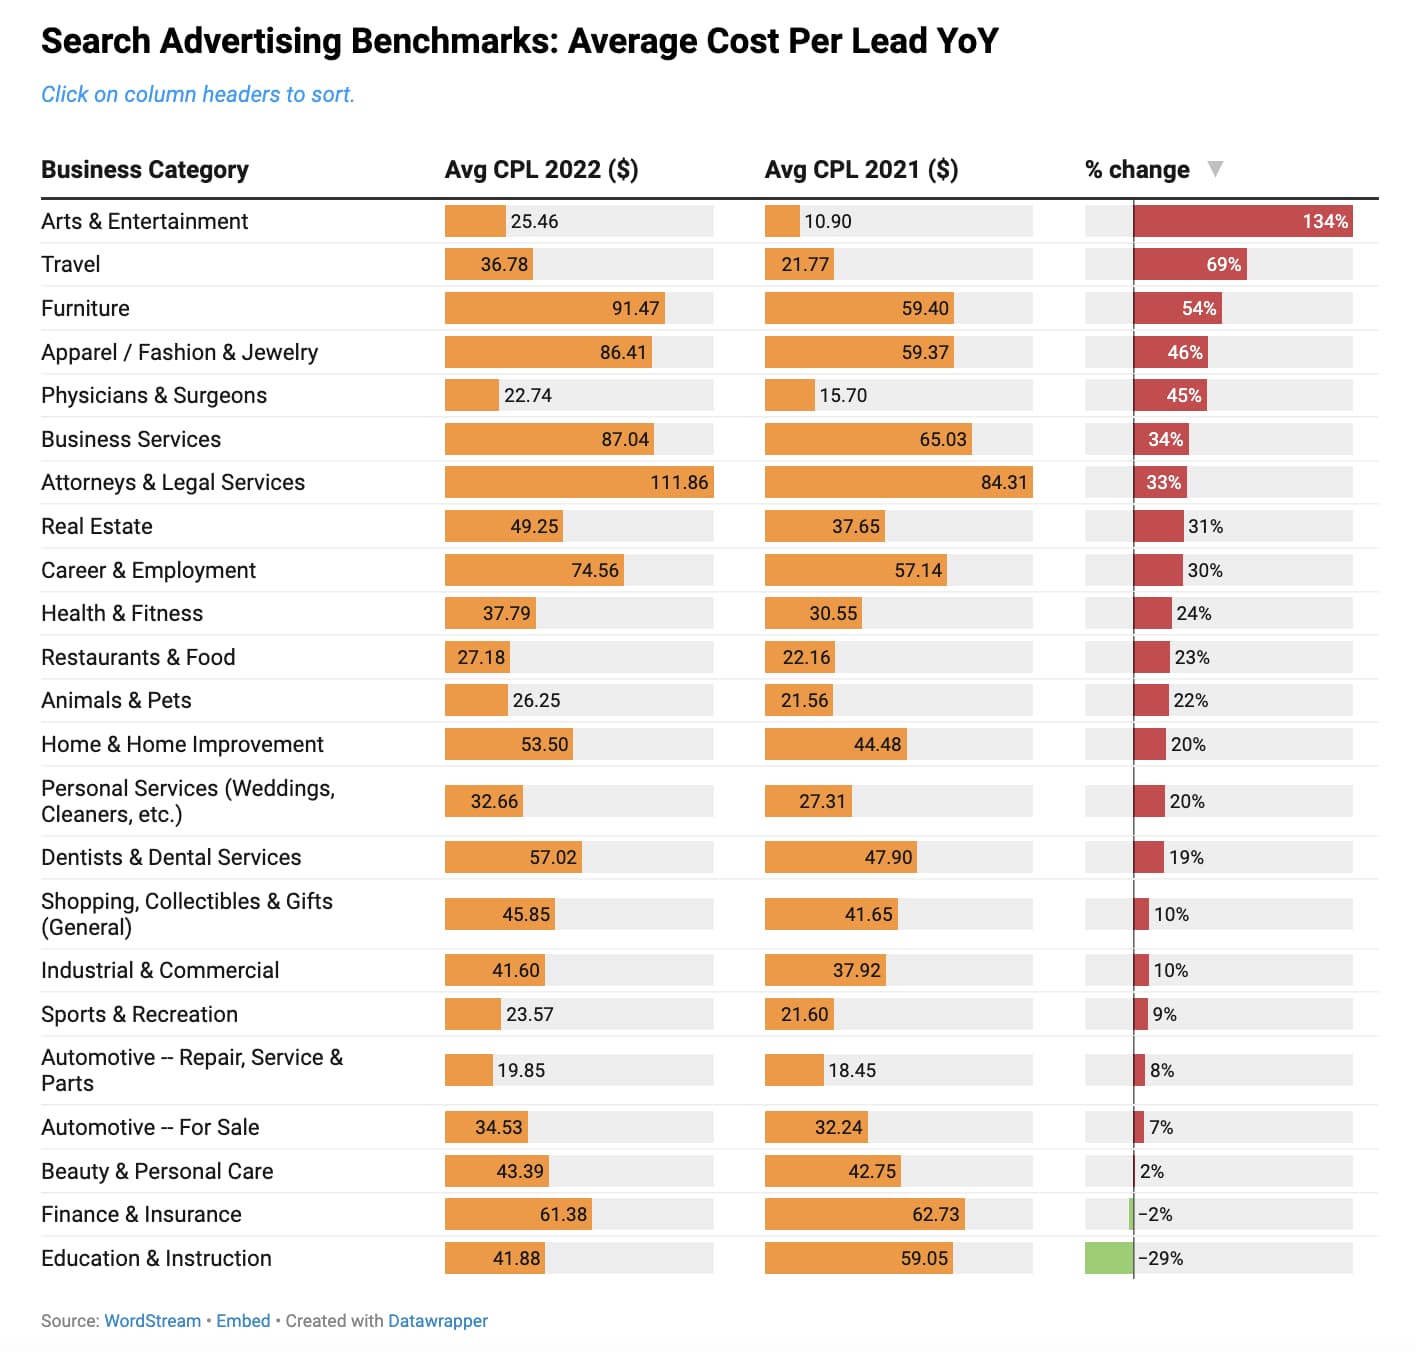
Year over year, 91% of the industries in the study saw an increase in CPL. While the average overall increase was 19%, there were some industries hit particularly hard: Arts/Entertainment (+134%), Travel (69%), and Furniture (54%).
Conversion rate
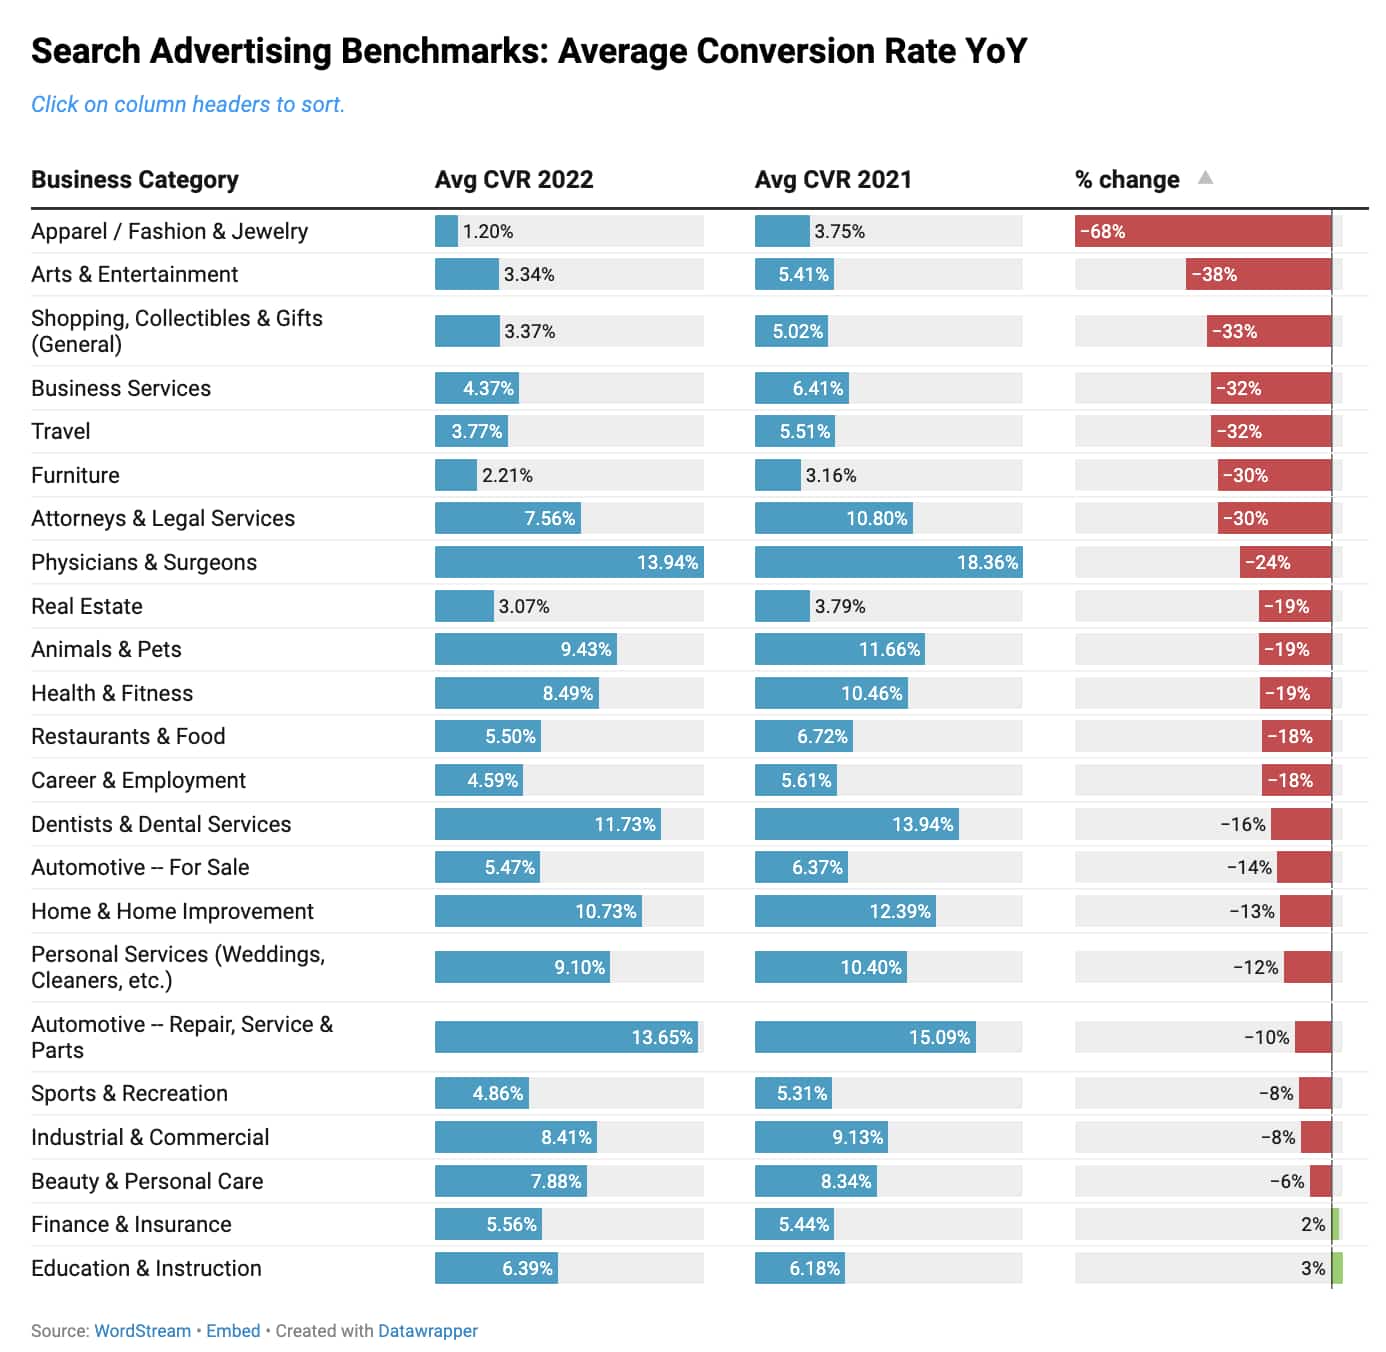
Conversion rate is the percentage of people who clicked on your ad and actually completed the action you wanted them to take. The average conversion rate for search ads is 7.26%.
This is a 14% decrease from last year, which is a steeper decline than the previous year’s decrease of 6%. Similar to cost per lead, 91% of industries saw a decrease in conversion rate.
The industries with the biggest decreases include Apparel/Fashion/Jewelry (-68%), Arts/Entertainment (-38%), and Shopping/Collectibles/Gifts (-33%).
Click-through rate
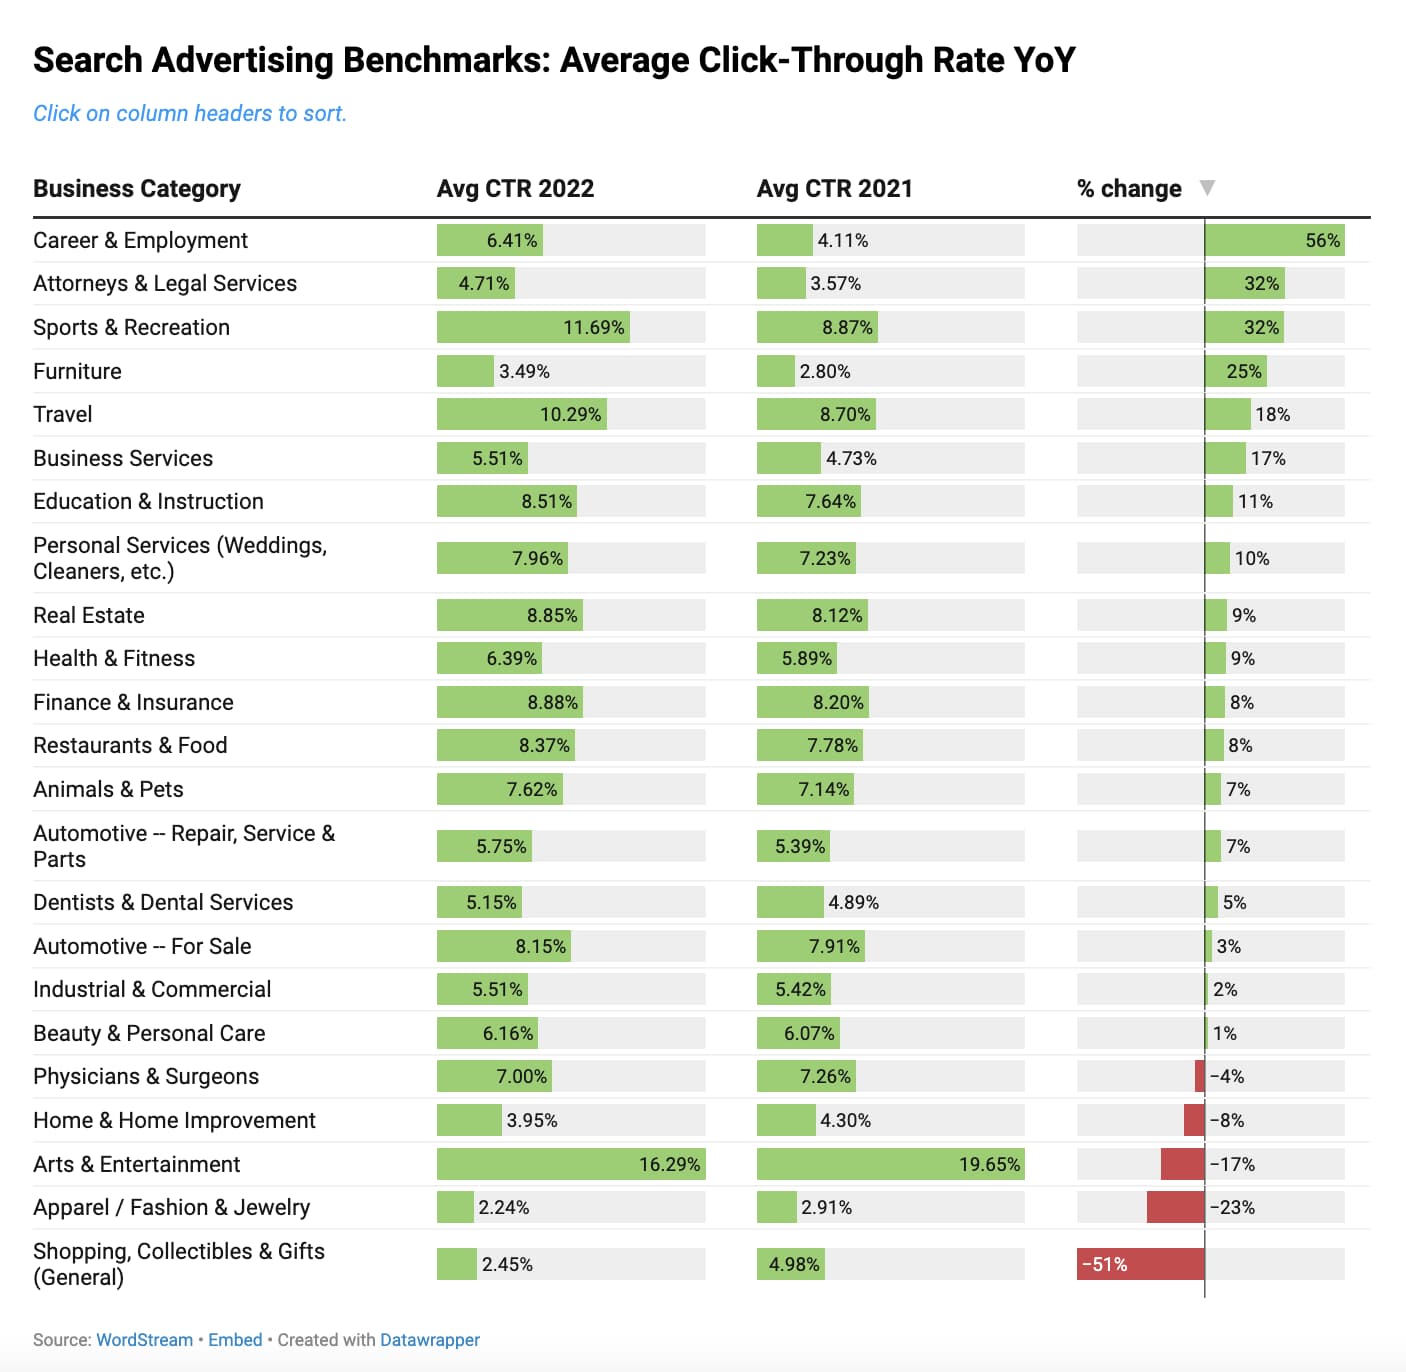
Just like display ad click-through rate (CTR), search advertising CTR tells you what percentage of people who see your ad actually click on it. The average overall click-through rate across all 23 industries in this report was 6.30%.
While 78% of the industries we looked at saw an increase in CTR, the average overall stayed exactly even with last year. Notable year-over-year changes include Career/Employment (+56%) and Shopping/Collectibles/Gifts (-51%).
Cost per click
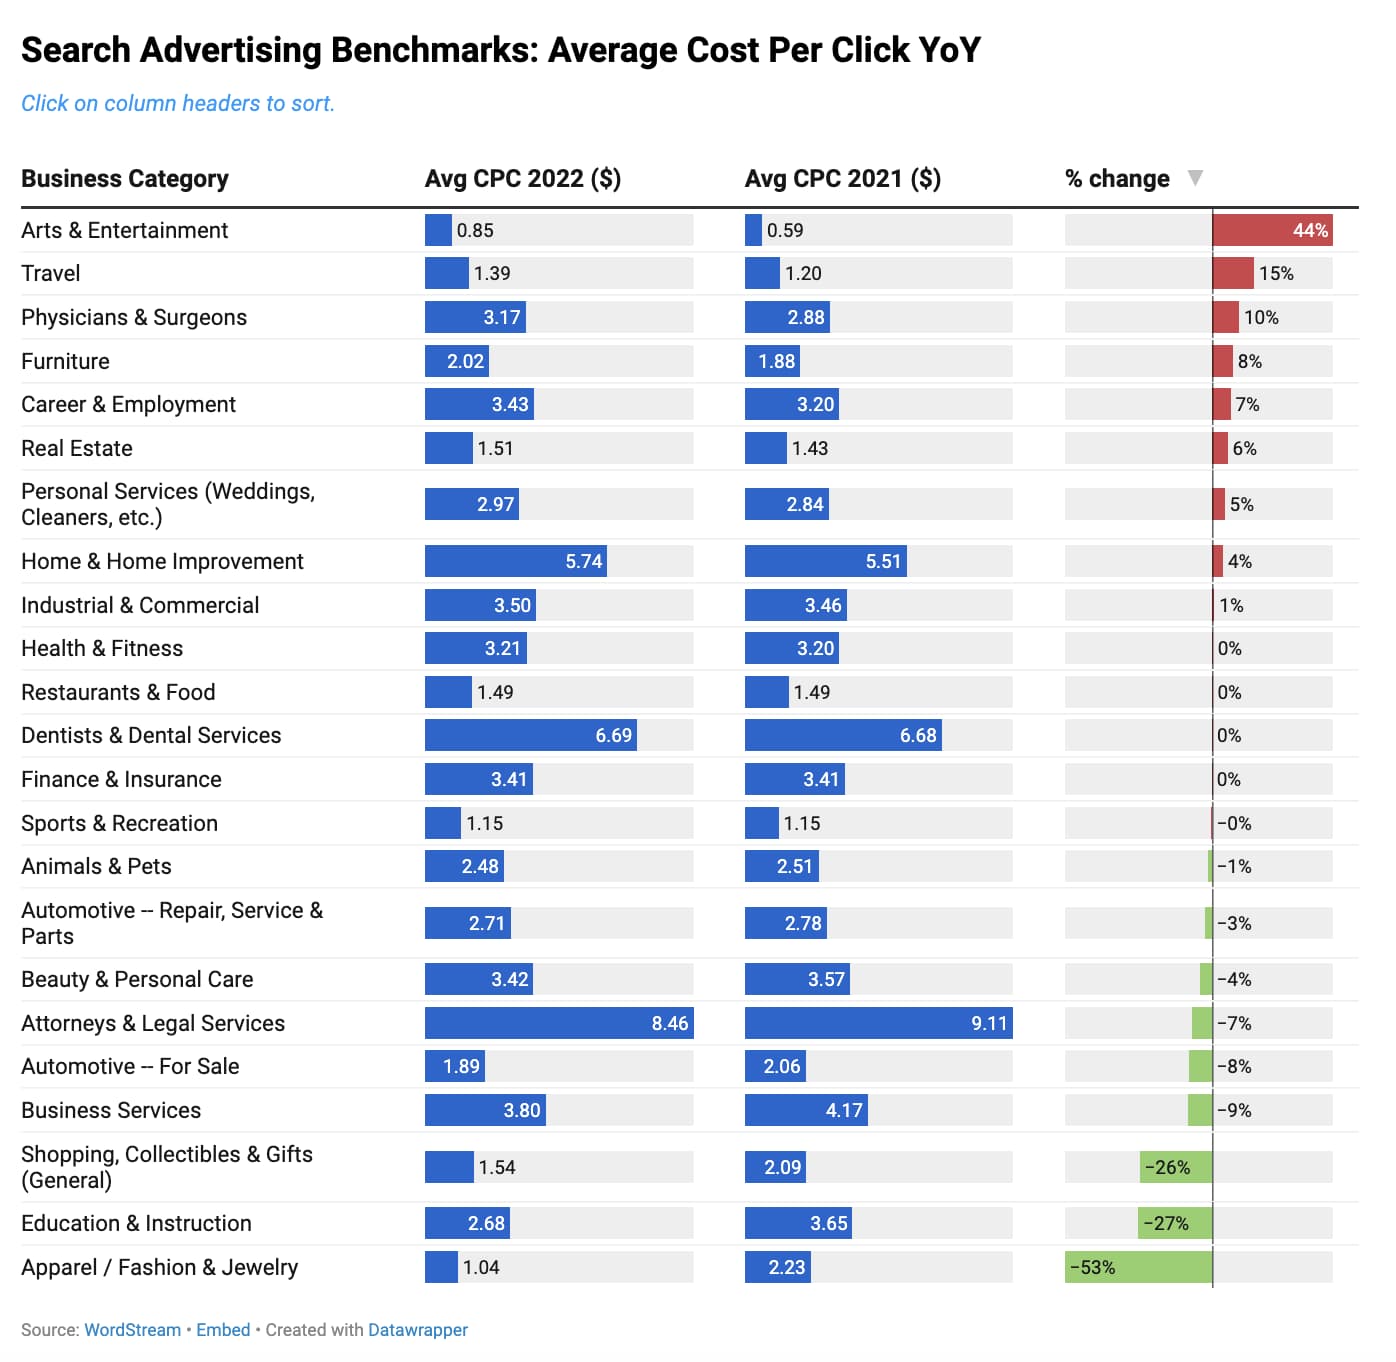
Cost per click is, of course, how much you’re paying for a click on your ad. The average cost per click across all industries is $2.96.
This is only a 2% increase year-over-year, although last year, we saw a decrease of 1%. The industries with the biggest increases in CPC include Arts/Entertainment (+44%), Travel (+15%), and Physicians & Surgeons (+10%).
How to Keep Your Search Ad Costs Low
So, based on the data and trends above, what can you do to lower your cost per lead? Here are some tips:
1. Focus on conversion rate optimization
With high consumer prices negatively impacting conversion rates, it’s more important than ever to make sure your landing pages are optimized for conversion.
In that sense, write clear, concise copy that caters to your targeted audience. Ensure that the content loads quickly, is mobile friendly and that the forms are easy to fill out. You should also be regularly A/B testing different elements—images, button colors, headlines, short-form vs. long-form copy—to see what resonates best with your audience.
2. Stay on top of negative keywords
It’s not just consumers adapting to inflation that is impacting conversion rates, but also Google increasingly showing ads on the SERP for low-intent searches. This means you need to monitor your search terms report and add irrelevant terms to your negative keyword lists.
3. Improve your Quality Score
To lower your cost per lead, you need to bring up your conversion rates (which we just covered above) and/or lower your cost per click—and the key to lowering your CPC? Raising your Quality Score.
So, in addition to optimizing your landing page user experience, organize your ad groups so that your ads and landing pages are super-relevant to the keywords you’re targeting. Keep your click-through rates up with compelling ad copy and precise targeting.
These are just a few of the many optimizations you can make in your Google Ads account. For more recommendations, you can use WordStream’s Free Google Ads Performance Grader.
4. Have a cross-channel strategy
While the intent to buy is highest on search engines, it shouldn’t be the only channel you use.
Social media and display ads are essential for building audiences and creating brand awareness, which can then enhance the performance of your search campaigns. In fact, one study found a 59% lift in conversions from searches triggered by a display ad.
And don’t forget that retargeting display ads are also highly effective in bringing interested prospects back to your site to convert.
Keep Your Search Ads Performing Their Best
What makes search advertising so effective is also what makes it so competitive. The higher the competition, the more you may need to increase your bids and budgets to get the same volume of traffic.
The good news is search advertising is known for being a high ROI marketing channel, and using the tips above and in the full report, you can do plenty before increasing your budget.
About the data
This report is based on a sample of 79,455 North American-based LocaliQ client campaign cycles in the outlined business categories that were running search ads between October 1, 2021 – September 30, 2022.
LocaliQ’s proprietary platform dynamically shifts budget between search channels on a campaign-by-campaign basis, but in aggregate, approximately 80-85% of the budget is allotted to Google and 15-20% to Microsoft.
Each business category includes a minimum of 250 campaign cycles. All currency values are posted in USD.
You can find the charts from this report, as well as previous benchmark data in an interactive format, on WordStream’s Online Advertising Benchmarks page.
About the author
Kristen McCormick is the Senior Managing Editor at WordStream, where she helps businesses make sense of their online marketing and advertising. She specializes in SEO and copywriting and finds life to be exponentially more delightful on a bicycle.