It’s time we stopped guessing about social media marketing and learned the facts and stats.
If you’re a social media marketer, you understand that keeping up with the social media statistics can help you build a powerful social media marketing strategy.
Social media stats provide valuable insights into the most popular social platforms, their users demographics, how people use each platform, and what type of content works best. This data can help you make data-driven decisions when building your social media strategy and manage your social communities better.
For everyone working in digital marketing, we’ve compiled this social media stats and facts guide. Here are some of the data you’ll find here below:
- The top most popular social media platforms
- Audience characteristics for each social network
- Usage habits of each network
- Best type of content by platform
- Engagement rates for each network
- Advertising costs
It’s important to note that all the data presented here has been vetted and collected from external researchers, industry whitepapers, and from the social networks’ official press releases.
Table of contents:
- Social media general usage statistics
- Social media advertising statistics
- Facebook statistics
- YouTube statistics
- Instagram statistics
- TikTok statistics
- Twitter statistics
- Pinterest statistics
- LinkedIn statistics
- Influencer marketing statistics
But before we dive into social media marketing statistics, let’s first see the context of online usage worldwide:
- Currently, there are 5.18 billion individuals who have access to the internet, out of 8 billion people, the total number of humans living on Earth. That is 64.4%;
- 95% of online users use a phone to go online;
- The average online user spends 6 hours and 35 minutes online every day.
A. Social Media General Usage Statistics
- Out of the 5.18 billion people who use the internet, 4.80 billion have a social media user identity. This means that 93% of internet users log in to at least one social media network;
- The average time spent on social media daily is 2 hours and 24 minutes;
- Instagram (33%) and Facebook (25%) are the most popular social networks for shopping. And that’s because they have the best shopping tools included in their apps.
Now, let’s see where people go to consume social media content the most.
1. The most popular social media platforms
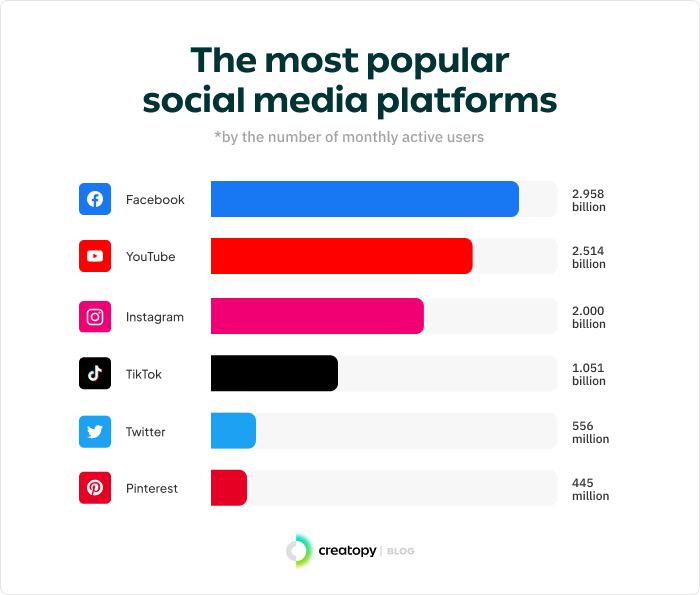
The most popular social media networks by number of monthly active users are very much the same as last year, with a few changes worth mentioning:
- Facebook continues to lead the way with 3 billion monthly users;
- YouTube is the second most-used social platform, with 2.514 billion users;
- Instagram is in the third place with 2 billion users;
- TikTok continues to grow year-on-year, with 1 billion users;
- Twitter counts 556 million monthly active users;
- Pinterest has 445 million active users.
2. How much time do people spend on social media?
- People spend more time on TikTok than on any other social app (45.8 minutes on average a day);
- On YouTube, people spend 45.6 minutes a day;
- On Twitter, 30.4 minutes a day;
- On Snapchat, 30.4 minutes a day;
- On Facebook, 30.1 minutes a day;
- On Instagram, 30.1 minutes a day.
3. Why do people use social media?
If you’re wondering what are all these people doing on social media, here is what HubSpot found:
- 61% of people use social media to keep up with friends and family;
- 51% for entertainment;
- 41% are looking to learn new things;
- 37% just want to share pictures/videos;
- 37% browse for inspiration/ideas;
- 36% want to keep up with news/cultural trends;
- 24% want to keep up with brands/products;
- 15% check on their favorite celebrities/influencers.
B. Social Media Advertising Statistics
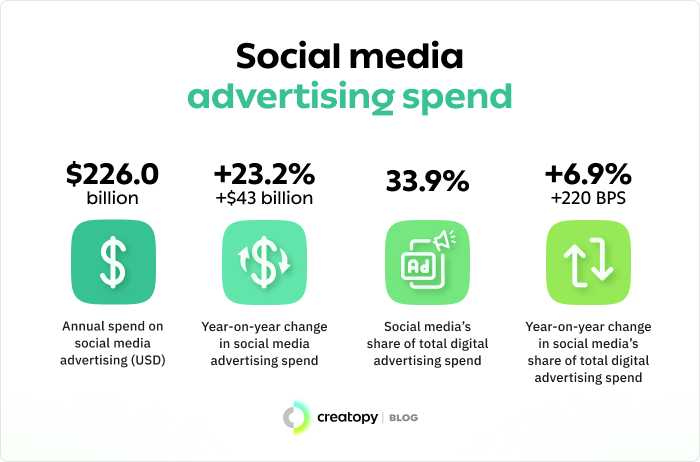
A digital report run by Meltwater and We Are Social found that:
- The annual spending on social media advertising grew to $226 billion in 2022, a 23.2% increase compared to the previous year.
- Social media advertising spend accounts for 33.9% of all digital advertising spend. That is a 6.9% increase compared to 2021.
- The costs to reach social media audiences are lower than ever: CPM (the cost to show an ad to 1,000 people) registered a 35% decline.
- This means that advertisers can show more ads to more people for less. Social platforms delivered 57% more ad impressions in Q4 of 2022 than in Q4 of 2021.
C. Facebook Statistics
1. Facebook usage statistics
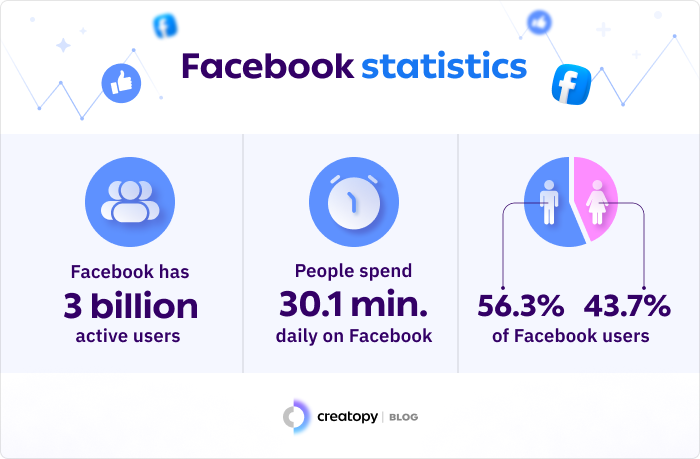
- Facebook has almost 3 billion monthly active users as of January 2023;
- 2 billion people go on Facebook every day to check their feed;
- 70% of American adults have a Facebook account;
- On average, people spend 30.1 minutes daily on Facebook;
- Most users (97.4%) access Facebook from their mobile devices.
2. Facebook demographics statistics
- The largest Facebook audience base resides in India, with 314 million users. The second largest audience is in the U.S. (170 million users), and the third is in Indonesia (119.9 million active users);
- 56.3% of Facebook users are men, and 43.7% are women;
- The largest part of the Facebook audience (29.9%) is aged between 25 and 34 years old.
3. Facebook content statistics
- The Facebook Feed content is split between: 50.7% posts from friends and people followed, 15.6% posts from groups joined, 8.2% updates from liked pages, 16.8% from unconnected posts, and 8.7% other information;
- 500 million people use Stories every day.
4. Facebook advertising statistics:
- 78% of American users have discovered a product on Facebook;
- 93% of marketers use Facebook advertising;
- In Q1 of 2023, ad impressions increased by 26% year-over-year, while the price per ad decreased by 17%, year-over-year;
- Facebook charges, on average, $0.94 per click, and $12.07 per 1.000 impressions;
- In 2022, Facebook’s parent company, Meta, reported a revenue of $116 billion.
- 4 million advertisers use Stories ads every month;
- Facebook Marketplace ads reach 562 million people.
D. YouTube Statistics
1. YouTube usage statistics
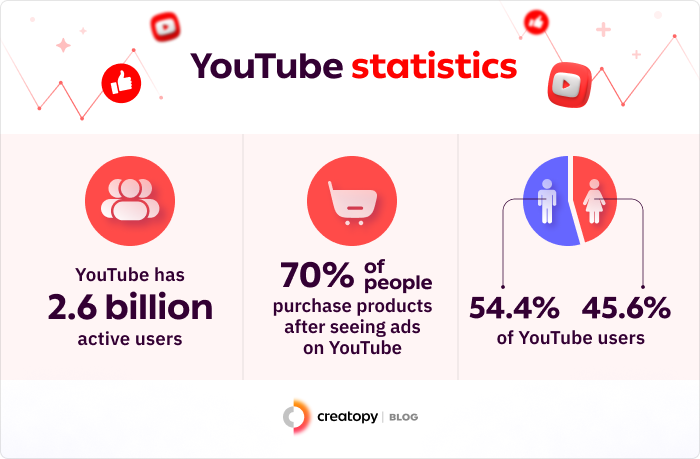
- YouTube has 2.6 billion monthly active users, which makes it the second most popular social network in the world;
- This means that 31.4% of all people on Earth use YouTube;
- India has the most YouTube users (467 million), followed by the U.S. (246 million) and Brazil (142 million);
- YouTube covers 100+ countries and 80 languages worldwide.
2. YouTube demographics statistics
- There are 54.4% of men and 45.6% of women who use YouTube;
- Users aged from 25 to 34 years old account for the largest share of YouTube’s audience base (20.7%). The next age group is from 35 to 44 years old (16.7%), followed by users aged 18 to 24 (15.0%);
- 89.5% of users access YouTube from their mobile devices.
3. YouTube content and engagement statistics
- English and Spanish are the most popular languages on the video platform;
- Currently, there are 51 million YouTube channels;
- The most popular content categories are Entertainment, Music, and People & Blogs;
- User interactions have a critical impact on the rankings of videos. #1 factor for ranking is the number of likes, followed by comments and shares.
4. YouTube advertising statistics
- Advertisers can reach a potential audience of 2.51 billion users on YouTube;
- 59% of users find YouTube ads more relevant than TV commercials;
- 70% of people purchase products after seeing ads for them on YouTube.
E. Instagram Statistics
1. Instagram usage statistics
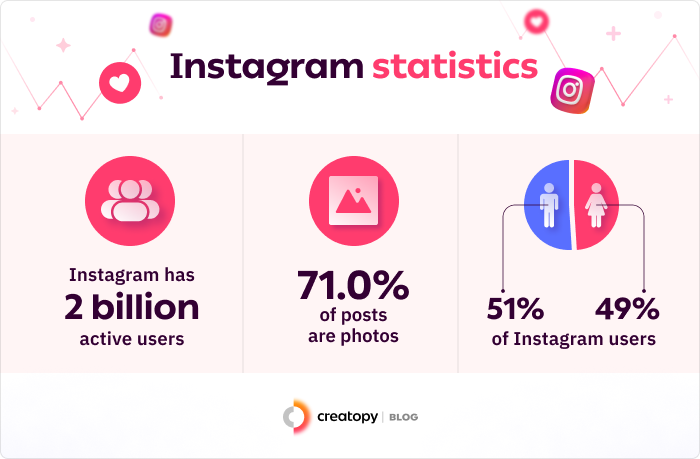
- Instagram is the fourth most-used social media network in the world, counting 2 billion users;
- 17.6% of the world’s population uses Instagram;
- Instagram is the second most downloaded app in the App Store;
- India has the most Instagram users (230 million), followed by the U.S. (144 million), and Brazil (113 million);
- The average time spent on this social platform is 30 minutes;
- 200 million businesses have an Instagram account.
2. Instagram demographics statistics
- The largest part of Instagram’s audience is made of users aged between 18 to 24 years old (30.8%), followed by people aged between 25 to 34 years old (30.3%) and 35 to 44 years old (15%);
- Instagram has more male users (51%) than female (49%).
3. Instagram content and engagement statistics
- The most followed Instagram accounts are Cristiano Ronaldo (591 million), Lionel Messi (473 million), and Selena Gomez (423 million);
- Carousels were the preferred type of content in 2021-2022;
- The most used #hashtags on Instagram were #Love, #Instagood, #Fashion, #Photooftheday, and #Instagram;
- Stories’ reach rate decreased from 5.4% in 2021 to 4.8% in 2022;
- Instagram posts’ reach rate has a higher reach than Stories;
- 71.9% of posts on Instagram are photos.
4. Instagram advertising statistics
- 90% of users follow a business;
- 71% of Instagram users purchased a product after they saw it on Instagram;
- Marketers can reach 1.3 billion users with ads on Instagram;
- Instagram was reported to be the second most-used social network by marketers in 2022;
- Instagram generated $43.2 billion in ad revenue in 2022;
- Instagram is the #1 platform for building relationships with brands;
- Instagram has the highest CPC at $3.56.
F. TikTok Statistics
It’s important to note that TikTok is banned in India, one of the world’s largest populations that is active on social media.
Considering that India and China account for a third of the world’s population and that TikTok is not present in these two countries, it definitely affects the figures. However, TikTok still has some impressive statistics when it comes to its user base.
1. TikTok usage statistics
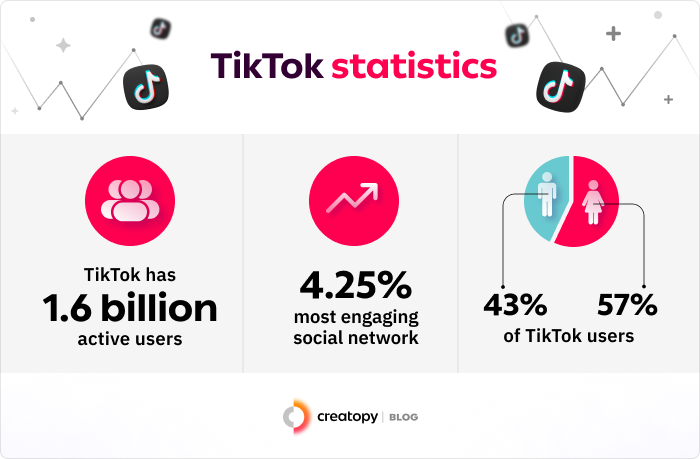
- TikTok has 1.6 billion users;
- It is the #1 most downloaded app in more than 40 countries;
- TikTok was the most downloaded app in 2022, with 672 million downloads. Since its launch, the app has been downloaded 3 billion times;
- The video platform is present in 150 countries across 35 languages;
- TikTok’s largest market is in the U.S. (113.2 million users), followed by Indonesia (110 million users) and Brazil (82 million users);
- The average user spends around 1.5 hours a day watching short-form videos and 19.6 hours a month.
2. TikTok demographics statistics
- TikTok’s audience is split between 57% women and 43% men;
- TikTok is Gen Z’s favorite social network;
- The largest part of TikTok’s audience (43%) is made of young people aged between 18 to 24 years old.
3. TikTok content and engagement statistics
- The most popular content categories (by hashtag views) are Entertainment (535 billion views), Dance (181 billion views), and Pranks (79 billion views);
- TikTok is the most engaging social media platform, with an engagement rate of 4.25%;
- 69% of the platform’s users watch sports events and updates on TikTok;
- The most used music track on TikTok is “Sunroof” by Nicky Youre & Dazy. 8.9 million videos were created on the platform using this sound;
- The most followed TikTok accounts are @khabi.lame (160.4 million), @charlidamelio (150.8 million), and @bellapoarch (92.7 million).
4. TikTok advertising statistics
- TikTok reported an estimated $9.4 billion in revenue in 2022, a 100% increase year-on-year;
- 50% of TikTok users have bought something after they watched a live video;
- 40% of Millennials, 57% of Gen Z, and 44% of Gen X said the platform helps them discover new products.
G. Twitter Statistics
While Twitter may not have billions of monthly users like other social networks, it’s still a valuable platform to connect and engage with people, or make use of real-time marketing. Twitter users are active and connected to current trends and events happening around the world. They value opinions and standpoints more than anything.
1. Twitter usage statistics
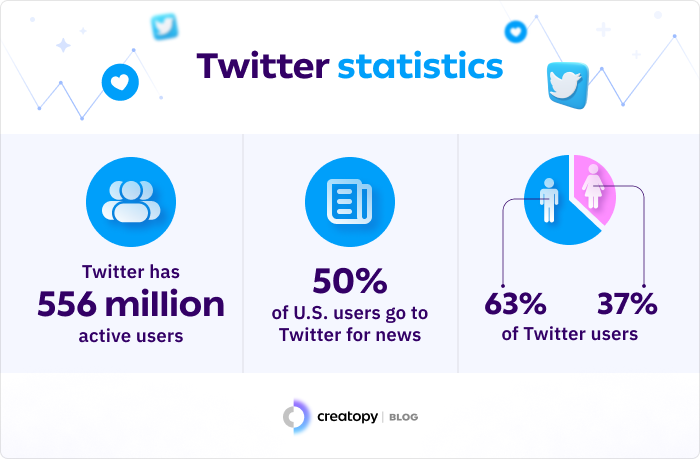
- Twitter has 556 million monthly active users;
- Most Twitter users reside in the U.S. (95.4 million users), followed by Japan (67.5 million users) and India (27.3 million users);
- 80% of users access Twitter from their mobile phones;
- On average, people spend 34.8 minutes on Twitter;
- 52% of users visit the site daily.
2. Twitter demographics statistics
- 63% of users are male, and 37% are female;
- Most users are aged between 25 to 34 years old (38.5%), followed by people aged 35 to 49 years old (20.7%), and 18 to 24-year-olds (17.1%);
- 33% of U.S. Twitter users have a college degree;
- 41% of users have a household income of approximately $75,000.
3. Twitter content and engagement statistics
- The most followed Twitter accounts are @elonmusk (144.2 million), @barackobama (132.2 million users), and @justinbieber (112.1 million users);
- Half of the U.S. social media users regularly get their news from Twitter;
- 46% of Twitter users say that the platform has helped them understand the world;
- 30% of users said that Twitter has increased their awareness of politics;
- 82% of people access the platform for entertainment;
- 1-2 hashtags can increase post engagement by 100% for individuals and 50% for brands;
- People watch 2 billion videos on Twitter every day.
4. Twitter advertising statistics
- Twitter reported an annual ad revenue of $4.4 billion in 2022;
- 67% of B2B businesses use Twitter as a digital marketing tool;
- Twitter ads have a 40% higher ROI than other media channels;
- 6% of social media marketers believe that Twitter offers the highest ROI when selling products directly in the app;
- Twitter’s CPM is the lowest among all social platforms.
H. Pinterest Statistics
Pinterest is another social network with only half a billion users, but still worth taking into consideration. People using Pinterest are active and engaged, and they browse the platform with one goal in mind: discovery. They access Pinterest to find inspiration for shopping or ideas for important life events, house decoration, cooking, and more.
85% of users have bought something based on pins from brands. Have a look at the other impressive Pinterest statistics and add this network to your digital marketing media kit.
1. Pinterest usage statistics
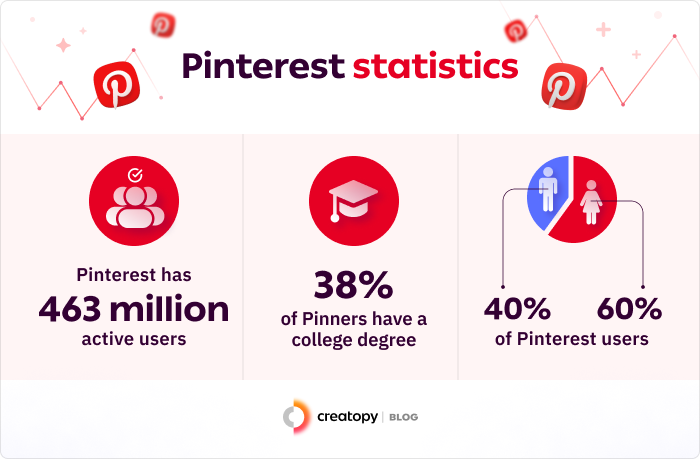
- Pinterest has 463 million monthly active users;
- Most Pinterest users live in the U.S. (84.6 million users), Brazil (28.1 million users), and Mexico (19.4 million users);
- People log in to Pinterest to search for inspiration and shopping ideas;
- 85% of users access Pinterest via their mobile phones.
2. Pinterest demographics statistics
- The user base is formed of 60% women and 40% men;
- 35% of U.S. Millennials use Pinterest;
- Users aged between 25 to 34 years old account for the largest part of Pinterest’s audience (35.6%), followed by people aged between 18 to 24 years old (21.9%), and users between 35 to 44 years old (14.6%);
- 45% of U.S. people with a household income over $100.000 are on Pinterest;
- 38% of Pinners have a college degree.
3. Pinterest content and engagement statistics
- Search-optimized pins have a lifetime of three months on the platform;
- 61% of users say Pinterest is where they go to start a new project;
- 85% of American users go to Pinterest to plan milestone life events;
- The most popular category on Pinterest is Food & Drink, followed by Women’s Fashion and Beauty.
4. Pinterest advertising statistics
- Pinterest generated $2.51 billion in advertising revenue in 2022;
- 80% of Pinners have discovered a brand or a product on Pinterest;
- The total number of potential users that Pinterest can reach with ads is 249.7 million people.
I. LinkedIn Statistics
LinkedIn is home to the largest social media community focused on the business side of things. It’s the perfect medium for companies and professionals alike to connect with other businesses. Simply put, it’s a thriving place for career-oriented people and businesses of all kinds.
LinkedIn members are young, educated, and ambitious, an audience that many brands aspire to reach and convert into customers.
1. LinkedIn usage statistics
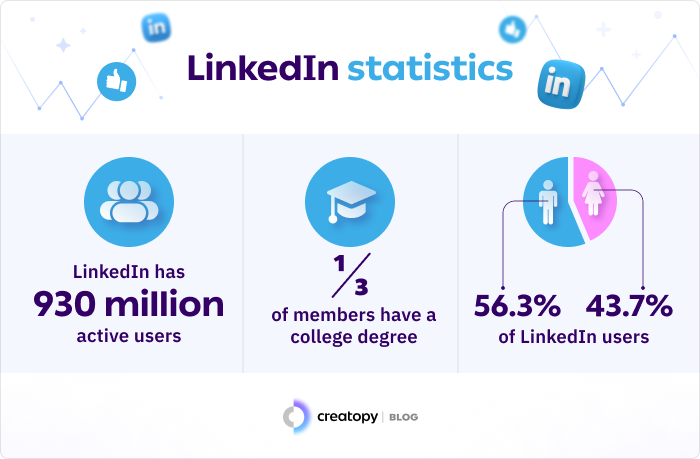
- LinkedIn has 930 million users;
- The platform covers 200 countries worldwide;
- The largest LinkedIn user base lives in the U.S. (200 million users), followed by India (99 million users), and China (60 million users);
- 137 million U.S. users (69%) use the platform daily;
- People spend an average of 7:22 minutes on the platform.
2. LinkedIn demographics statistics
- 56.3% of users are male, and 43.7% are female;
- Most LinkedIn members are aged between 25 and 34 years old (55.8%), followed by people aged between 18 to 24 (21.1%), and users from 35 to 54 years old (20.1%);
- 50% of LinkedIn users have a household income of more than $75,000;
- One-third of users have a college degree and 23% have a master’s degree.
3. LinkedIn content and engagement statistics
- 77% of B2B marketers said that organic (non-paid) content published on LinkedIn produced the best results;
- Videos get 5 times more engagement on LinkedIn than simple posts;
- Live videos get 25 times more engagement than simple posts;
- Profile pages with complete information get 30% more weekly views;
- Long-form content performs best on LinkedIn.
4. LinkedIn advertising statistics
- B2B marketers say that LinkedIn ads are the most effective channel for driving high-quality leads;
- Brands have seen a 33% increase in purchase intent after potential customers have been exposed to LinkedIn ads;
- 82% of B2B marketers achieve success through LinkedIn compared to other platforms;
- 79% of B2B marketers who ran ads on LinkedIn said the platform produced the best results;
- In 2022, LinkedIn reported an ad revenue of $5 billion.
J. Influencer Marketing Statistics
1. Influencer marketing general statistics
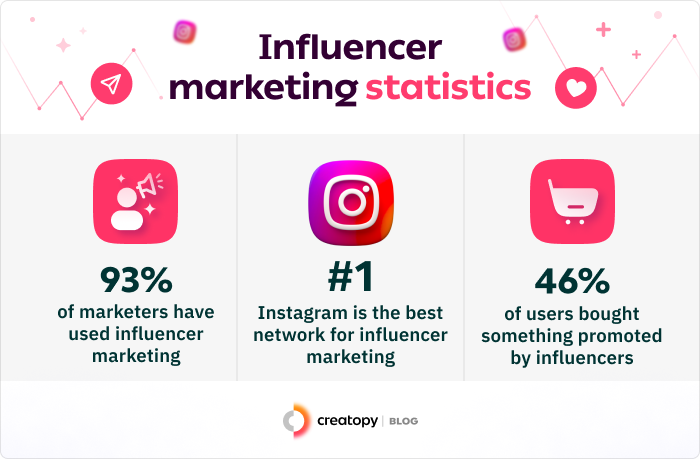
- 93% of marketers have used influencer marketing as part of their digital strategy;
- Instagram is the preferred social network by brands for influencer marketing campaigns;
- There are many types of influencers: bloggers, YouTubers, podcasters, and social posts influencers;
- 62% of social media users trust influencers that are A-list celebrities;
- Mega-influencers are influencers that have at least one million followers on a social network;
- Brands are turning to micro-influencers more and more. Micro-influencers will be the influencers of the future.
2. Influencer marketing demographics statistics
- Female influencers dominate influencer marketing, with 83% of all influencer marketing deals;
- Influencers over 65 years old charge three times more per post than younger influencers;
- Influencers with an annual household income of more than $150,000 or more per year charge 1.6 times more for a sponsored post than influencers earning less.
3. Influencer marketing content & engagement statistics
- The most mentioned brand on Instagram in 2022 was Zara;
- The most mentioned brand on TikTok in 2022 was Netflix;
- The average paid post on TikTok is $3,514, $4,491 on YouTube, $1,170 on Instagram, and $833 on Facebook;
- Micro-influencers (10,000-49,000 followers) charge an average of $1,674 per post;
- Influencers with followers between 50,000-199,999 charge an average of $3,386 per post;
- Macro-influencers (200,000-499,999 followers) charge an average of $4,992 per post;
- Mega-influencers (500,000-999,999 followers) charge an average of $5,497 per post;
- Celebrity influencers (1 million+ followers) charge an average of $5,865 per post.
4. Influencer marketing advertising statistics
- In 2022, the influencer marketing industry reached $16.4 billion;
- 46% of social media users have purchased something promoted by influencers;
- 36% of social media users say influencer posts are the best way to motivate them to try new products;
- Brand deals make up 68.1% of influencers’ revenue.
Stay up-to-Date With Social Media Statistics
Now, you can use these stats and insights to make better decisions for your brand’s social media communication.
We will be updating this resource frequently once we come across new social media statistics. Keep up with the ever-changing data on the most used social media platforms, audience demographics, usage habits, the best type of content, ad types, and advertising costs per social network.

